How to Find Undervalued Stocks: Practical Value Stock Screening Guide
Discover how P/E, P/B, EV/EBITDA, and FCF yield help spot long-term opportunities and avoid falling businesses.


In the previous chapter, we opened topics around the core principles of investing - rules that help protect your portfolio from ending up with empty bags. Now, I think it’s time to dive a little deeper into the math behind stock screening.
As we already discussed, finding undervalued stocks is not about predicting the next market winner (we are not trying to find a stock that will deliver 1,000% growth in a single year) or reacting to short-term market movements. For me, it’s about understanding what a business is truly worth and comparing that value with what the market is offering today.
Over time, I’ve learned that the market often miss-price companies - sometimes because of fear, sometimes because expectations are unrealistic, and sometimes simply because a business is boring. Every one of these situations is exactly where value investors should start looking.
In this article, I’ll walk through how I approach value stock screening, which metrics I focus on, the tools I use, and a short real-world example from my own analysis.
What It Really Means When a Stock Is "Undervalued"?
I’ve seen many times how people claim that any stock whose price has fallen is automatically undervalued. Nothing could be further from the truth. Not all companies will grow over time - and many of them simply won’t exist ten years from now.
A stock is undervalued when:
- The market price is below its intrinsic value
- Business fundamentals remain solid
- The long-term outlook is better than current market sentiment
While this may sound simple on paper, the real challenge begins when trying to identify stocks that meet all these conditions without confusing a falling business with a truly undervalued one.
Practical Stock Screening Methods for Identifying Undervalued Stocks
It is never a good idea to rely on a single metric. Every valuation ratio tells only one part of the story, and on its own it can be misleading. When multiple metrics are viewed together, they help separate short-term noise from real long-term opportunity.
1. Price-to-Earnings (PE) and forward Price-to-Earnings (fPE)
The Price-to-Earnings ratio (P/E) shows how much the market is willing to pay today for one unit of a company’s earnings. In simple terms, it tells us whether a stock is priced cheaply or expensively relative to its profits.
P/E is often the first filter in my analysis — but never the final decision.
There are two main versions:
- P/E (trailing), which is based on earnings from the past 12 months
- Forward P/E (fP/E), which uses expected earnings for the next year
Trailing P/E shows how the business has performed, while forward P/E reflects market expectations about the future (usually next 12 months). A big gap between the two often signals either strong expected growth or overly optimistic assumptions - both require closer attention.
When I look at P/E, I focus on:
- P/E below the company’s historical average
- P/E compared with industry peers
- Stable or growing earnings supporting the valuation
A low P/E on its own does not automatically mean value. Sometimes it simply reflects declining business quality or structural problems. This is why PE should never be used without context.
2. Price-to-Book (P/B)
The Price-to-Book ratio (P/B) compares a company’s market value to the value of its net assets on the balance sheet. In simple terms, it shows how much investors are paying for what the company already owns.
P/B is especially useful when analyzing:
- Financial institutions
- Asset-heavy businesses
- Cyclical companies trading near market lows
A P/B below 1 can be interesting, as it suggests the market values the company for less than its stated assets. However, this only makes sense if those assets are real, properly valued, and capable of generating returns.
When I look at P/B, I focus on:
- Whether assets are not overstated
- Whether the company is profitable or close to recovery
P/B is a much harder ratio to properly interpret than P/E. It should not be used for software companies or service-based firms, as they typically have very few physical assets on their balance sheets.
3. Enterprise Multiple - EV/EBITDA
One of my favorite valuation metrics because it allows a clearer comparison between companies with different capital structures. By using enterprise value instead of market capitalization, it looks beyond accounting differences and shows what a business is really worth as a whole.
\( Enterprise Multiple = \frac{EV}{EBITDA} \)
Where:
EV = Enterprise Value = Market Capitalization + Total Debt − Cash and Cash Equivalents
EBITDA=Earnings before Interest, Taxes, Depreciationand Amortization
This metric is especially useful when evaluating long-term value or potential takeover scenarios, as it reflects how the market values the company’s operating performance. When I use EV/EBITDA, I prefer companies trading below the industry average, with stable or improving EBITDA margins and manageable debt levels.
4. Free Cash Flow Yield (FCFY)
Free Cash Flow (FCF) represents the cash a company generates after covering its operating expenses and necessary capital investments. It is the money that remains available to pay dividends, reduce debt, buy back shares, or reinvest in the business.
Free Cash Flow Yield measures how attractive a company’s valuation is by comparing its free cash flow per share to its current market price. In simple terms, it shows how much real cash you are getting for the price you pay. A higher free cash flow yield often signals a stronger ability to meet obligations and create long-term value for shareholders.
From my experience, it’s important to understand why free cash flow yield is increasing, not just that it is increasing:
- If revenue is stable and margins are healthy → positive signal
- If revenue is falling and capex is being cut just to preserve cash → potential risk
A high FCFY combined with stable revenue often reflects market pessimism rather than real weakness in the underlying business.
Tools and Platforms I use on regular basis
I keep my toolkit simple and focused. Some of the platforms I regularly use:
- StockAnalysis – quick fundamentals and historical ratios
- Finviz – fast screening and market overview
- TradingView – charts and long-term technical context
- Yahoo Finance – financial statements and historical data
- Investing.com – macro context and market sentiment
- Company investor relations pages – underrated but essential
- Google Sheets – to track valuation changes and assumptions over time
The tool itself doesn’t matter as much as how consistently you use it.
Example of a Short Stock Valuation: Why I Consider Amazon Undervalued (January 2026)
As of last financial report, I consider Amazon undervalued, but with important risks which should not be ignored. On a valuation level, Amazon is trading at a trailing P/E of around 32 and a forward P/E just above 30, suggesting stabilizing profitability compared to historical levels.

Its P/B ratio sits above 6, which is high relative to physical assets - I would like to remind that much of Amazon’s value is intangible and requires careful consideration.
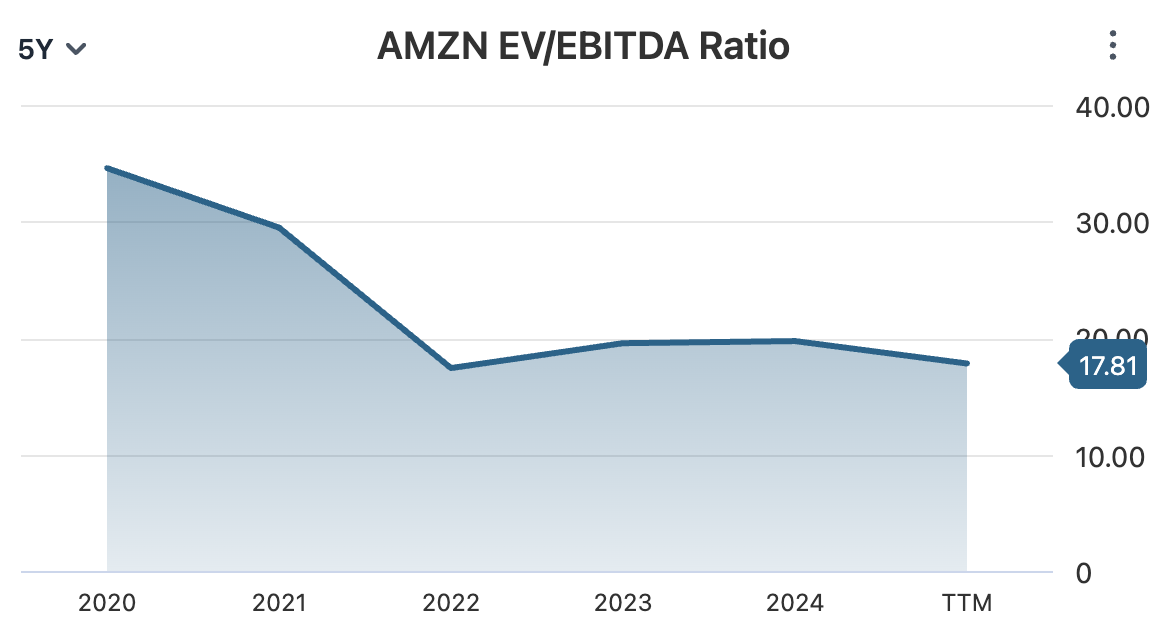
From an enterprise perspective, EV/EBITDA is below 18, lower than long-term peaks, showing the market is cautious despite improving margins.
Free cash flow yield remains very low at around 0.44%, reflecting continued capital-intensive investment in logistics, cloud, and content. This low FCF yield highlights that, while Amazon generates significant revenue, a large portion is reinvested into growth rather than immediately returning cash to shareholders.
Overall, the current valuation reflects market skepticism more than business weakness. Amazon is not a risk-free bet, but when considering normalized earnings, operating cash flow, and its long-term growth engines, the stock shows potential value for patient, disciplined investors.
Final Thoughts
Learning how to find undervalued stocks is less about formulas and more about thinking for yourself. If a stock looks too perfect, it usually means you don’t fully understand the business. Every company comes with its own risks, and it’s important to separate what truly matters for the business from what is just noise.
Good value stock screening helps you:
- Eliminate obvious risks
- Focus on financially strong businesses
- Stay patient when the market disagrees with you
Over time, I’ve found that consistent processes beat clever predictions. If you can combine solid screening with emotional discipline, the market will eventually reward you.
Up Next — Chapter Five: How to Value a Business
In the next chapter, we’ll explore practical ways to value a business using methods like Discounted Cash Flow (DCF), Comparable Companies (Multiples), and the Dividend Discount Model (DDM). Charts and tables will help make each approach easy to understand and compare.
Whether you’re analyzing a growth stock or a dividend payer, these frameworks show what a company is truly worth.
This was Chapter Four of the Value Investing Guide.
If you haven’t read Chapter Three, click the button below to learn about origins of Value Investing
Or, if you want to start from the beginning here's a place to start: Investing with Reason: How Engineering Led Me to Value Investing